
Are your trades aligned with the market’s true value?
Most trading tools show you movement.
VWAP Flux shows you accepted value – the prices where real volume has actually committed.Instead of reacting to candles, VWAP Flux maps live value zones built from rolling VWAP layers, so you can see where trades make sense before you enter, not after.
✔ Adaptive multi-VWAP value map
✔ No fixed bands, no lagging averages
✔ Designed for real-time decision-making
✔ Built on real traded volume, not price alone
You probably trade based on the current price
But the level that truly matters is the fair-value zone – the area where the market accepts transactions, where buyers & sellers genuinely agree without distortion.

Price can rise, drop, spike, or sweep in seconds.When analysis is built on price alone, traders quickly lose sight of where true value sits.And once that anchor disappears, familiar problems appear again:
buying too high
selling too low
chasing mid-trend moves
entering where the market never truly supported the idea

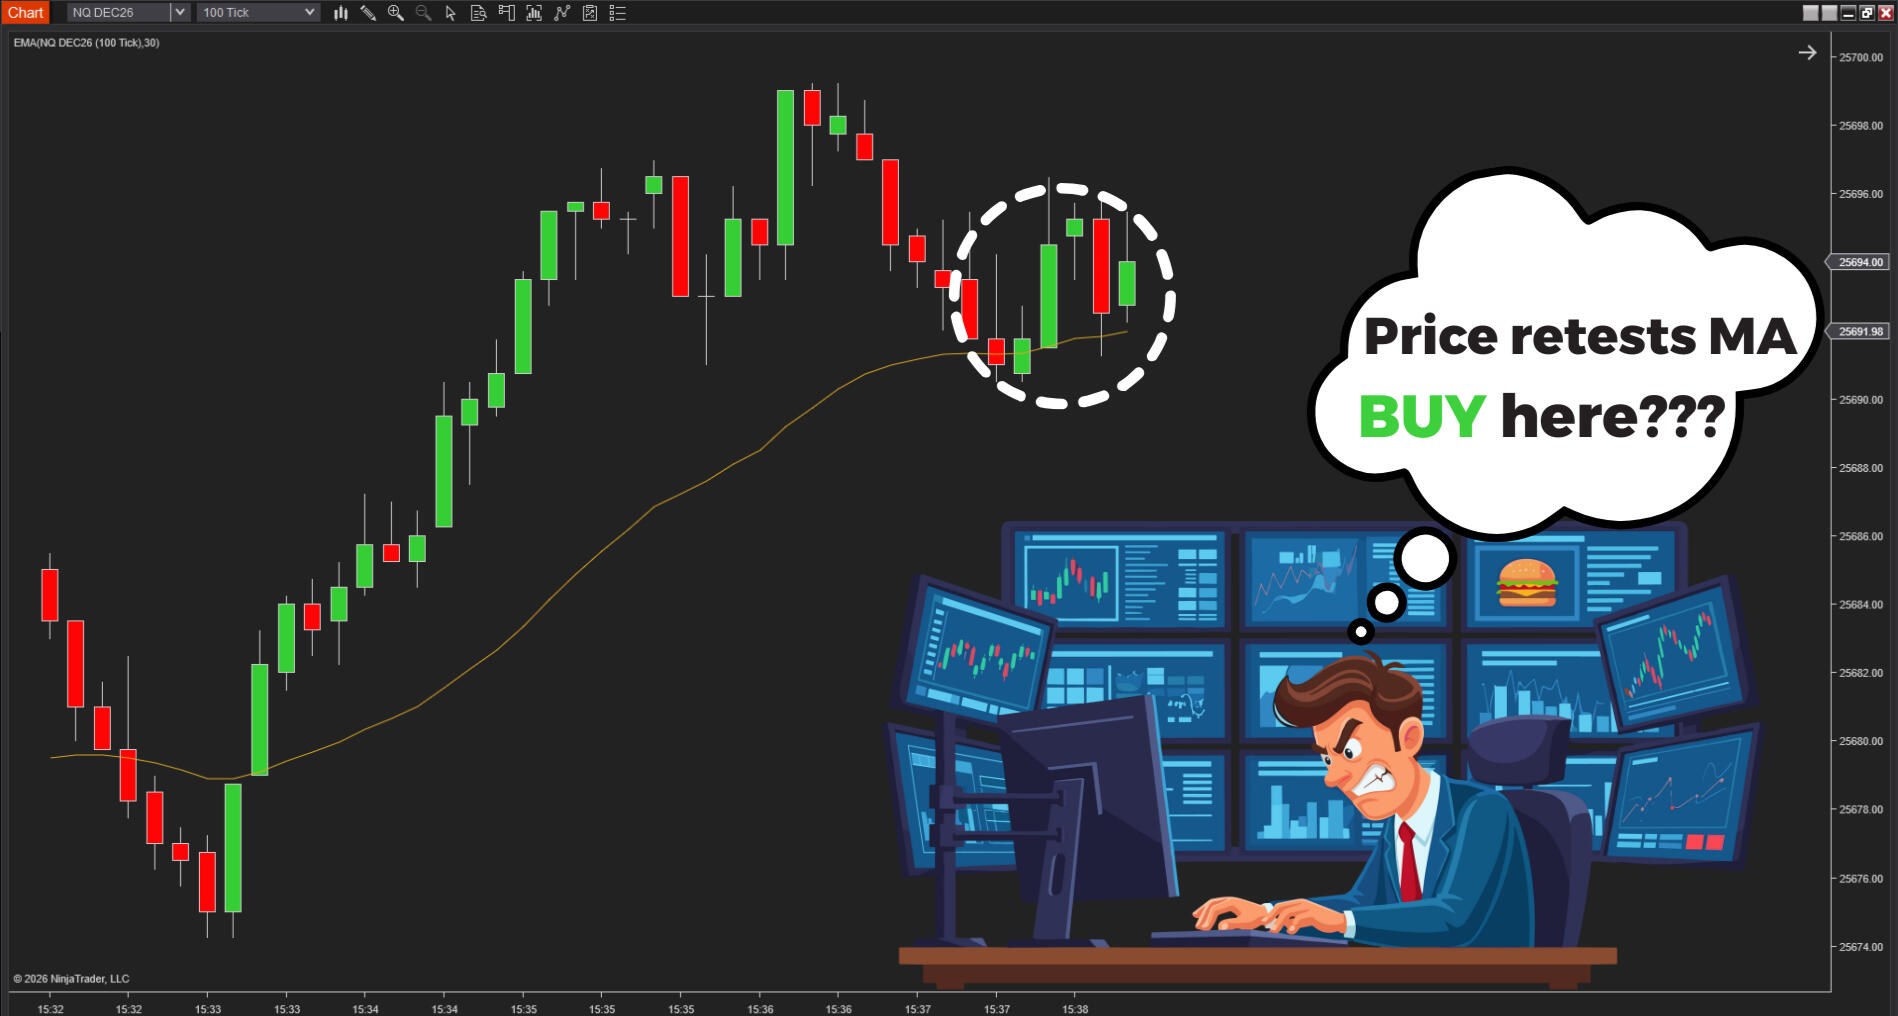
Searching for stability, many traders turn to Moving Averages.MAs are popular because they help track direction and highlight dynamic support or resistance.But there’s a structural limitation: MAs are built from price alone.They ignore volume – the element that reveals whether the market accepts a level or quietly rejects it.When volatility expands or order flow shifts, an MA can drift far from the market’s real structure.
VWAP is better... but it still has clear limits
Price answers a simple question: “Where is the market right now?”VWAP answers a more meaningful one:
“Where is the market relative to the value that real money has actually traded and accepted?”Because VWAP is a volume-weighted average price, it reflects traded value, not just movement.However, the traditional VWAP draws a single central line over the entire session.
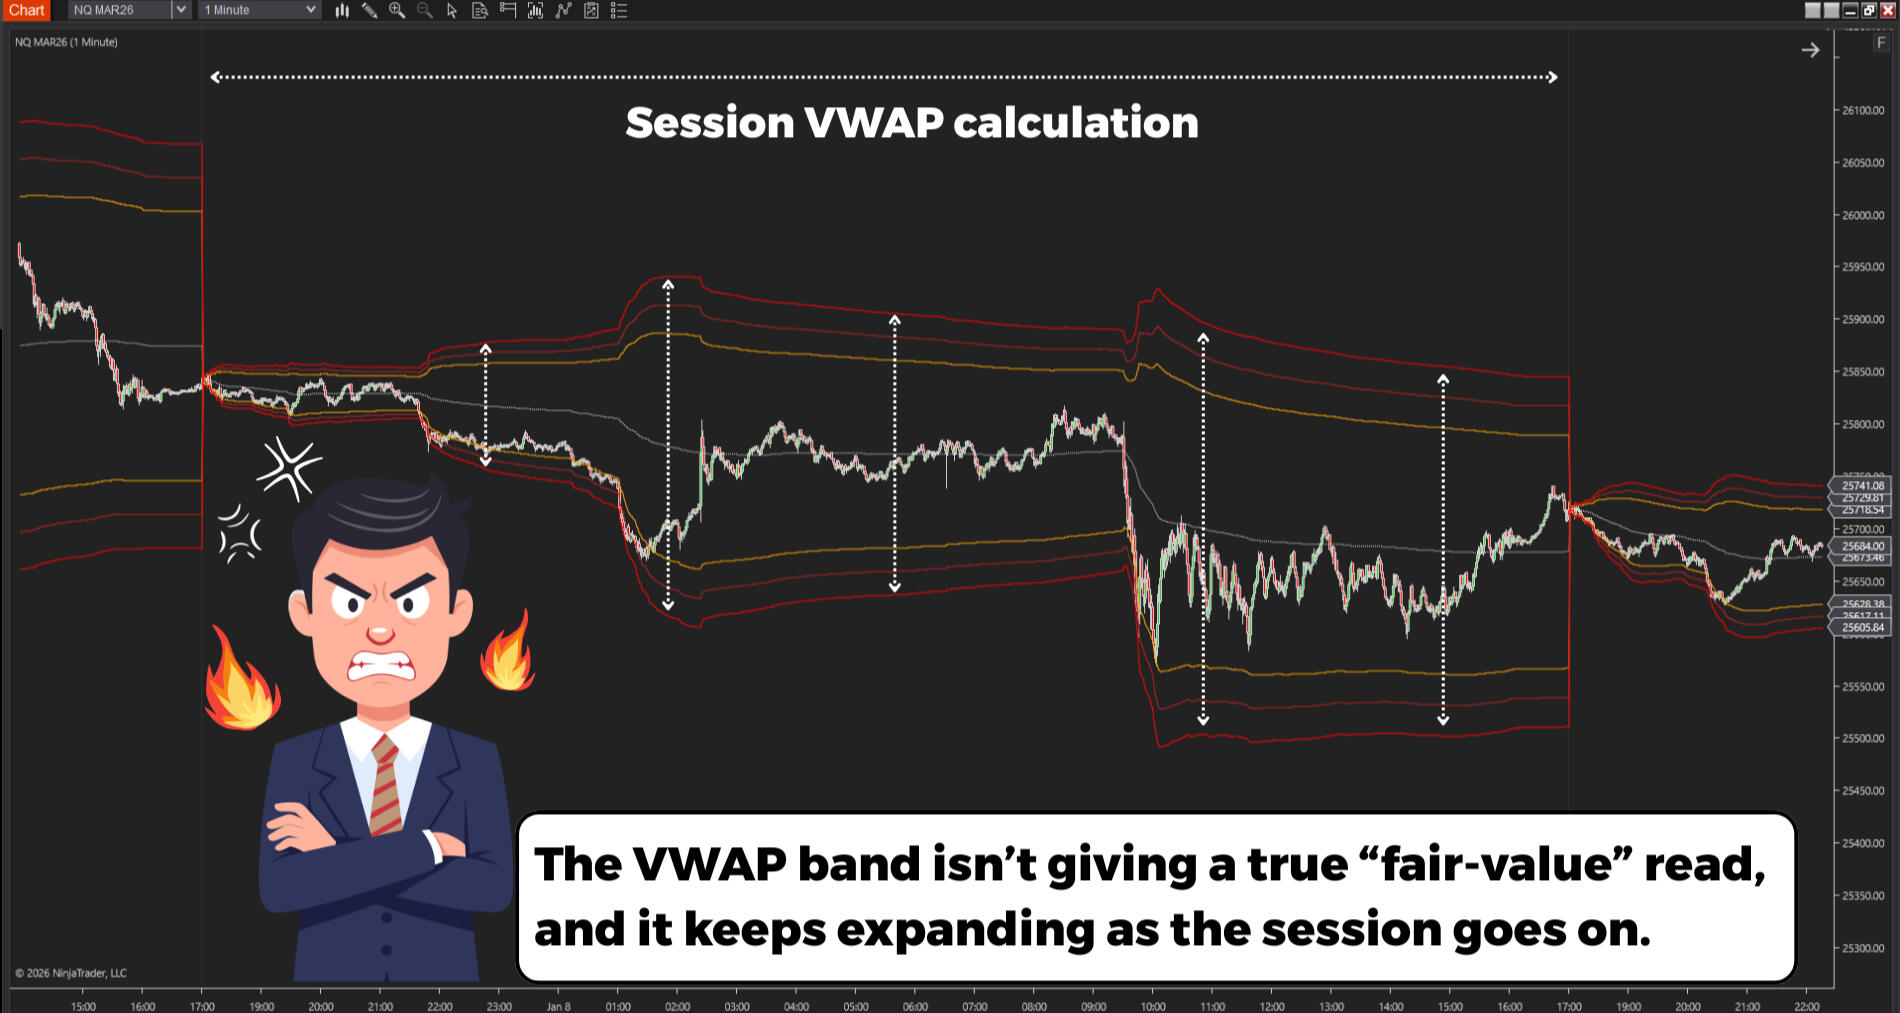
It never resets or adapts to smaller segments of time, making it slow to reflect how value shifts throughout the day.And the challenge doesn’t end there.
Using fixed multipliers, VWAP bands attempt to represent value boundaries – but they fail to capture the market’s true structure.When volatility increases, these bands widen dramatically, not because value has changed, but because price has accelerated.The result is a set of broad, imprecise zones that offer little guidance when traders need clear reference points the most.
Introducing VWAP Flux...
Transforming what traditional VWAP cannot capture
VWAP Flux uses a linear-based methodology to overcome the structural weaknesses found in traditional VWAP.Instead of relying on a single session-wide calculation, VWAP Flux divides the market into smaller time segments – 10 minutes, 30 minutes, 1 hour, and more – and automatically recalculates VWAP for each segment.This allows value to update as the market evolves, not just once per session.Traditional VWAP bands depend on fixed multipliers. These multipliers expand dramatically during volatility, creating wide zones that lose their practical meaning.VWAP Flux takes a different approach...


It forms dynamic bands based on 2 key parameters:
AnchorPeriodMinutes: The time span of each VWAP layer.
Example: AnchorPeriodMinutes = 30 → each layer reflects the most recent 30 minutes of traded value.
Amount: How number of recent VWAP layers included in the trading cloud.
Example: Amount = 3 → the indicator selects the 3 most recent VWAP layers to form the band.
Interested with this indicator?


These controls give you the ability to adjust how responsive or stable their value zones are – something a traditional VWAP cannot offer:
Smaller Amount values → more responsive bands, suitable for fast markets.
Larger Amount values → steadier bands that reveal broader swings and market rhythm.
This concept aligns with the approach widely discussed by Brian Shannon, author of Technical Analysis Using Multiple Timeframes:“The market has a memory for the price at which significant events occurred.
By anchoring the VWAP to multiple key benchmarks – such as the session open, a swing high, and a significant news event – we gain a more complete picture of the developing market structure.”
Interested with this indicator?
Trade where it matters, not more – with VWAP Flux
VWAP Flux turns VWAP from a single reference line into a complete value-map – built from multiple VWAP layers tied to the latest price-volume behavior.


1. Fair Value Plot: The market’s balance point
The Fair Value Plot marks the price level where trading activity concentrates the most – essentially:
The price that market participants “pay the most”.
The true center of value for the session you’re analyzing.
When price moves above or below this level, you immediately see whether the market is pricing higher or lower relative to where the majority of volume has agreed on value.The Fair Value Plot acts as the anchor point of balance, from which all other value layers in VWAP Flux are structured.


2. The 5-layer market map: VWAP Cloud
VWAP Flux builds 5 continuously updated value layers:
Highest / Upper / Median / Lower / LowestEach layer reflects a different degree of value acceptance in the market. Combined, they form the VWAP Cloud, which functions as:
A dynamic value-based S/R zone: As more layers stack together, you see a clearer picture of where supply & demand are actively forming — right at the areas the market considers fair.
A “value terrain” for pullback trading: When price enters the Cloud, you can read the depth of the pullback. Pullback traders can instantly identify which layer represents the currently defended value zone.
The Cloud defines the natural operating range of price – the area where the market is truly negotiating value.
3. Trend Direction & Strength
VWAP Flux evaluates trend by measuring how price interacts with true market value – a more reliable and grounded perspective than price-alone analysis.A Trend Signal is confirmed only when all 3 core conditions align:
Price vs. Fair Value Plot: Is price trading above or below real value?
Cloud Break: Has price completely moved outside the value Cloud?
Cloud Slope: Is the value structure rising or falling?
Trend strength is measured through cumulative volume delta and displayed via Fair Value Plot intensity – darker or lighter.At a glance, you can assess:
whether the trend is supported by value,
whether a position should be held,
whether expectations should be reduced due to weakening momentum.


4. VWAP-Anchored Pullback Signals
Pullbacks need a stable, dependable anchor – a level price naturally returns to.VWAP fits this role because it reflects the truest intraday balance point shaped by real traded volume.That’s why pullback traders instinctively rely on it:
A strategy built on returning to equilibrium works best when that equilibrium is accurate.VWAP Flux takes this concept further.When price touches the VWAP Cloud, it is effectively returning to the market’s accepted value zone.If the prevailing trend structure remains intact at that moment, the pullback becomes a high-quality Buy/Sell opportunity.
5. Static Support/Resistance with POC & VWAP
Traditional S/R levels rely only on price history.VWAP Flux enhances this by analyzing volume within each candle, because not every high or low carries the same weight.This helps you gauge trend durability:
Absorption zones: strong, stable trends; trade with confidence
Push zones: temporary moves; best used for targets, not frequent entries
VWAP Flux also highlights key levels within each zone:
POC: the price with the highest traded volume
Intra-zone VWAP: the average price actually paid by market participants
Together, these levels show where price is likely to react and provide guidance for optimal stop and target placement.


Webinar replay
Why is VWAP Flux 3x better than standard VWAP?
In this webinar, Mr. James explained how VWAP Flux is a major upgrade to traditional VWAP. Its core strengths are being dynamic, real-time, and clearly revealing market structure.He also explained why it is ideal for traders who already use VWAP, want better market context, and need earlier insight into support, resistance, and buying-selling pressure.
How VWAP Flux behaved in Real Market conditions
This video shows the ApexFlow Zignal and VWAP Flux strategy in real-time performance, fully automated by the Infinity Algo Engine$.
This video explains how ApexFlow Zignal and VWAP Flux work together.ApexFlow Zignal shows order flow control, while VWAP Flux defines fair value and market structure.Push signals inside the VWAP band highlight higher-quality setups with stronger continuation potential.
This video focuses on testing the performance of VWAP Flux in challenging market conditions, with full transparency, no cherry-picking, and an evaluation of how it handles losing streaks during live trading.
Watch the new release video of VWAP Flux to get the indepth info for this indicator:
In this video, James Buchman explains why VWAP Flux is essential for VWAP traders, highlighting how it identifies very clear support and resistance zones for easier trade opportunities.
At the start of the US session, the market is often chaotic – making it difficult to trade with structure and discipline.
To see how well VWAP Flux performs under real pressure, we put it to the test right at the opening hour of the session.In the live test you’ll see in the video, VWAP Flux is used with 2 trading approaches:
- Pullback trading: relying on VWAP Flux’s core value-based signals
- Mean reversion: entering at static S/R zones and setting targets at the VWAP bands, aiming for price to revert toward fair value
In this real-time live trading video, watch how VWAP Flux captures 4 trades and over 200 ticks in just 3 minutes.
See how price responds when it reaches accepted value zones & read genuine feedback from our wonderful ninZaFamily traders.
Review the 90-day backtest results of VWAP Flux on GC!


Read genuine review from our pro traders:


Concerns you might be thinking about
Choose your special pricing option during Early Bird stage
VWAP Flux only
(1) VWAP Flux license: $700 value
Personalized support: $100 value
1-year product update: $150 value
Trader's manual & templates: $100 value
During early bird event, it'll be:
$396
Core Power bundle
(1) VWAP Flux license: $700 value
(1) Triple-Range Rover license: $500 value
Personalized support: $100 value
1-year product update: $150 value
Trader's manual & templates: $100 value
In total $1550, but during this stage:
$406
New Release bundle
(1) VWAP Flux license: $700 value
(1) ApexFlow Zignal license: $2,500 value
Personalized support: $100 value
1-year product update: $580 value
Trader's manual & templates: $100 value
In total $3680, but during this stage:
$916
Most Valuable bundle
(1) VWAP Flux license: $700 value
(1) Captain Optimus Strong license: $2200 value
Personalized support: $100 value
1-year product update: $580 value
Trader's manual & templates: $100 value
In total $3680, but during this stage:
$916
Premium Algo bundle
(1) VWAP Flux license: $700 value
(1) Infinity Algo Engine$ license: $2700 value
Personalized support: $100 value
1-year product update: $680 value
Trader's manual & templates: $100 value
In total $4280, but during this stage:
$1076
Your purchase is backed up with our 45-day exchange policy

Use the complete indicators in live market conditions for 45 days.
Run them on your preferred platform, your markets, and your trading approach.If you don’t experience a clear improvement in market clarity, timing, or risk-to-reward awareness, we’ll exchange it for any other indicator with little to no additional cost.
Start trading around accepted value today
Stop reacting to price movement. Start seeing where the market actually agrees.
Quick-start instruction for ninZa.co indicators
Interested with this indicator?